Map › Guides › Wind, Weather & Water › How to read a kitesurfing wind forecast
The Kitesurfing Compendium · Wind, Weather & Water
How to read a kitesurfing wind forecast

Three kinds of tool, and most riders end up with all three open:
- A table forecast, which prints raw model output per three-hour block: wind speed, gusts, direction arrows, temperature, cloud in three layers, rain and a star rating. Its value is depth: stack GFS, ICON and AROME for one spot and you see whether they agree.
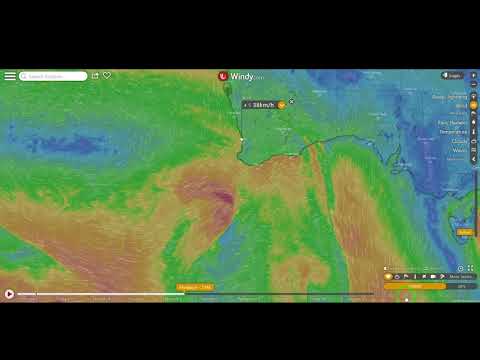
- A map forecast, which animates the same models over a chart. Best for the pattern: where a front is, how a thermal cell builds through the day, what the next 72 hours look like.
- A live station feed. Cross-check the forecast against observed wind at a station near the spot before you drive. Every spot page here links the forecast for its own coordinates, so you are not guessing which grid point to read.
What the numbers and models actually mean
A forecast is the output of a numerical weather model, a physics simulation run on a grid. On a coastline the grid size decides almost everything:
- GFS (American, global, ~13 km grid): available everywhere, good for the multi-day trend and for open-ocean trade-wind regions like Brazil, Cape Verde and Dakhla. Too coarse to see a sea breeze, a venturi or a bay 5 km wide, so it misses local effects outright.
- ECMWF (European, global, ~9 km): generally the most accurate global model. A 2026 comparison against live coastal stations reportedly put it within ±3 knots about 70% of the time.
- ICON (German) and AROME (French, ~1–2 km grid): high-resolution regional models, strong in and around Europe. AROME in particular resolves the thermal and coastal effects the global models smear out.
- NAM and HRRR: the North American high-resolution equivalents.
Using them:
- Compare at least two models. If a global and a local high-resolution model agree on strength and direction, confidence is high. If they diverge wildly the situation is unstable, so plan loosely.
- Trust the 24–48 hour window. Beyond three days you are reading trends, not sessions.
- Read the gust line, not just the average. Average 20 gusting 30 is a rougher day than average 24 gusting 27.
- Check direction against the beach, not the compass. A beautiful 20-knot arrow is worthless, or lethal, if it points offshore at your spot.
- Learn your spot's bias. Thermal spots blow over forecast; shadowed or urban spots blow under. Keep a log, mental or literal.
Watch · 3


More from Wind, Weather & Water
The other articles in this chapter- Which wind direction is safe for kitesurfing?
- How gusty is too gusty?
- How to read a kitesurfing wind forecast
The Fundamentals · Learning the Sport · The Gear · Buying Gear & Keeping It Alive · Tech & Innovation · Wind, Weather & Water · Safety & Risk · When Things Go Wrong · Rules & Etiquette · Advanced Riding · Spots of the World · Practical Tricks & Life Hacks · The Video Library · Field Notes & Extras